Last Updated by NASA on 2025-05-01
1. Developed by the NASA Socioeconomic Data and Applications Center (SEDAC) operated by the Center for International Earth Science Information Network (CIESIN) at Columbia University, HazPop combines data and map layers from various sources including NASA's Land, Atmosphere Near real-time Capability for EOS (LANCE) and Global Imagery Browse Services (GIBS), the U.S. Geological Survey (USGS), and others using a variety of open Web mapping services.
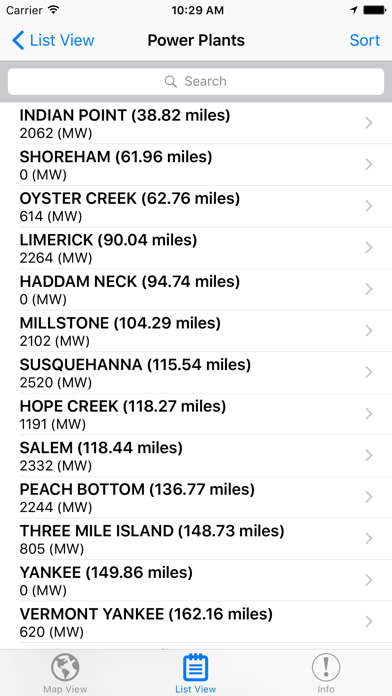
2. HazPop supports a number of other functions including: Monitoring regions around an area of interest, e.g. hazardous area prone to natural disasters, major infrastructure, or densely populated areas; Sorting dams, nuclear power plants, or earthquakes by proximity to your location or by their characteristics; Determining the distance from your location to any point on the map or between any two points on the map.
3. Hazards and Population Mapper (HazPop) is a free app that enables users to easily display recent natural hazard data in relationship to population, major infrastructure, and satellite imagery.
4. HazPop is designed to be used by disaster risk managers, humanitarian response organizations, public health professionals, journalists, and others needing a quick assessment of the potential dangers posed by a major hazardous event or developing emergency.
5. For example, a disaster response agency can obtain a rough estimate of the population and major facilities near a recent earthquake as an input into response planning.
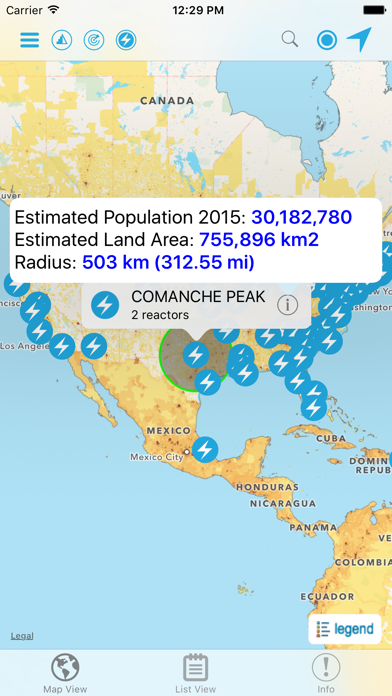
6. The app shows the location of major dams and nuclear power plants and provides more detailed information and imagery for these facilities where available.
7. Due to the coarse resolution and varying quality of some of the data, HazPop is not intended to support in-depth risk assessment or location-specific response needs.
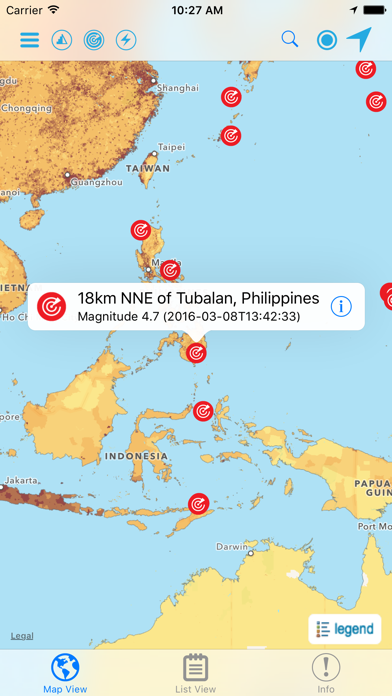
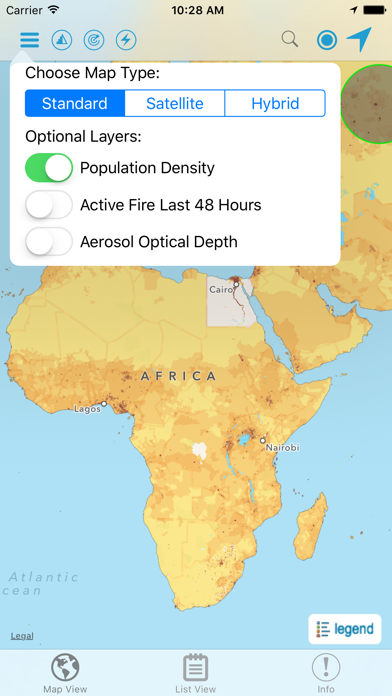
8. Hazards data include the location of active fires over the past 48 hours; earthquake alerts over the past seven days; and yesterday′s air pollution data measured from space.
9. By drawing a circle around a point or area of interest on the map, users can obtain an estimate of the total population and land area enclosed within.
10. The custom population estimates are provided by the SEDAC Population Estimation Service (PES) based on SEDAC′s Gridded Population of the World, version 4 (GPWv4) data for 2015.
11. Journalists or students can explore the location of recent wildfires relative to dense populations, roads, terrain, and water bodies.
12. Liked Hazards and Population Mapper? here are 5 Reference apps like Population Clock HD; Planting Population Calculator; Bible; 韩剧TV-追剧大本营; Muslim Pro: Quran Athan Prayer;
Or follow the guide below to use on PC:
Select Windows version:
Install Hazards and Population Mapper app on your Windows in 4 steps below:
Download a Compatible APK for PC
| Download | Developer | Rating | Current version |
|---|---|---|---|
| Get APK for PC → | NASA | 3.33 | 2.0 |
Get Hazards and Population Mapper on Apple macOS
| Download | Developer | Reviews | Rating |
|---|---|---|---|
| Get Free on Mac | NASA | 6 | 3.33 |
Download on Android: Download Android
great reference
Disappointing
LAUGHABLE!
 PC Apps