Last Updated by APPSKOUSIKA SOTWARE DEVELOPERS (OPC) PRIVATE LIMITED on 2025-07-23

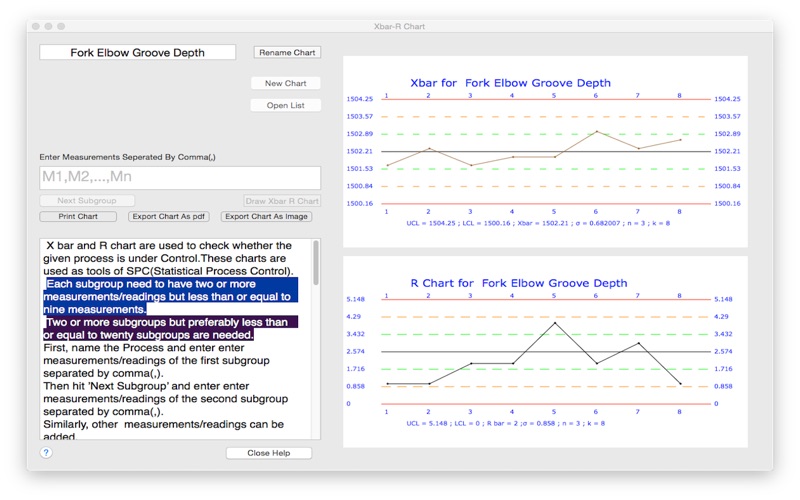
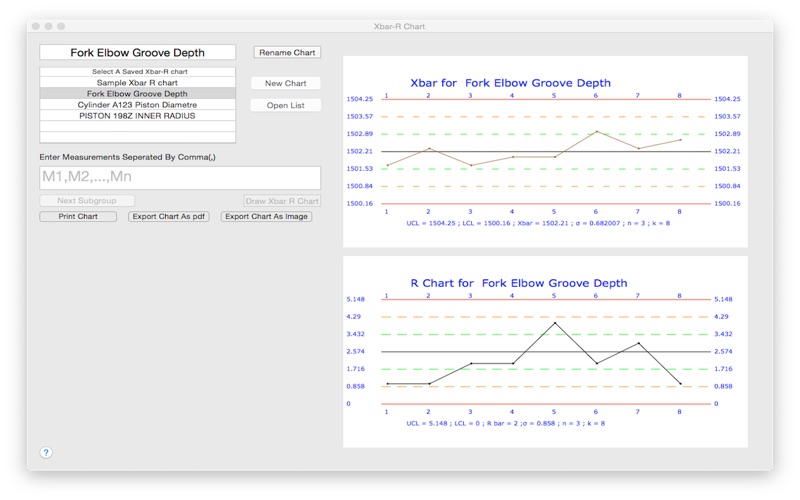
1. X bar and R chart are used to check whether the given process is under Control.These charts are used as tools of SPC(Statistical Process Control).
2. Each subgroup need to have two or more measurements/readings but less than or equal to nine measurements.
3. Two or more subgroups but preferably less than or equal to twenty subgroups are needed.
4. Liked Xbar-R chart? here are 5 Business apps like ADP Mobile Solutions; Indeed Job Search; Microsoft Teams; Zoom Workplace; DoorDash - Dasher;
GET Compatible PC App
| App | Download | Rating | Maker |
|---|---|---|---|
 Xbar-R chart Xbar-R chart |
Get App ↲ | 0 1 |
APPSKOUSIKA SOTWARE DEVELOPERS (OPC) PRIVATE LIMITED |
Or follow the guide below to use on PC:
Select Windows version:
Install Xbar-R chart app on your Windows in 4 steps below:
Download a Compatible APK for PC
| Download | Developer | Rating | Current version |
|---|---|---|---|
| Get APK for PC → | APPSKOUSIKA SOTWARE DEVELOPERS (OPC) PRIVATE LIMITED | 1 | 1.5 |
Get Xbar-R chart on Apple macOS
| Download | Developer | Reviews | Rating |
|---|---|---|---|
| Get $2.99 on Mac | APPSKOUSIKA SOTWARE DEVELOPERS (OPC) PRIVATE LIMITED | 0 | 1 |
Download on Android: Download Android
 PC Apps