Last Updated by Vernier Software & Technology on 2025-04-21
What is Vernier Graphical Analysis GW?
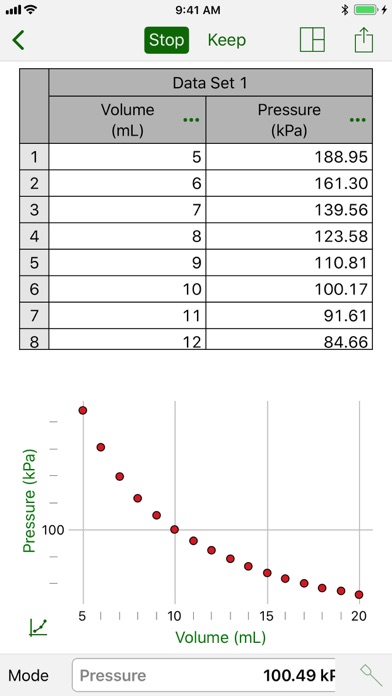
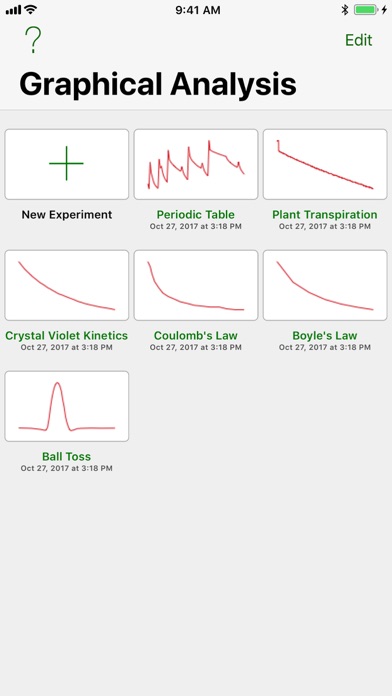
Graphical Analysis GW is a data analysis tool designed for science students to collect, graph, and analyze data from Vernier Go Wireless sensors. It supports various sensors, including Vernier Go Wireless Temp, Go Wireless pH, Go Wireless Heart Rate, Go Wireless Exercise Heart Rate, LabQuest sensors, and NODE sensors. The app also offers additional experiment options, such as data sharing via Wi-Fi connection to LabQuest 2 or Logger Pro 3, built-in sensors, and manual entry. The app is a part of the extensive system of sensors, interfaces, and data-collection software from Vernier for science and STEM education.
1. Vernier Software & Technology has over 35 years of experience in providing effective learning resources for understanding experimental data in science and math classrooms.
2. Note: Sensor data collection and Data Sharing require the purchase of hardware from Vernier Software & Technology.
3. Graphical Analysis™ GW is a tool for science students to collect, graph, and analyze data from Vernier Go Wireless® sensors.
4. Graphical Analysis GW is a part of the extensive system of sensors, interfaces, and data-collection software from Vernier for science and STEM education.
5. Built-in sensor and manual entry of data can be performed without a hardware purchase.
6. Liked Vernier Graphical Analysis GW? here are 5 Education apps like Vernier Graphical Analysis; Vector Sum Graphical; Vernier Spectral Analysis; Vernier Video Physics; Vernier Go Wireless;
GET Compatible PC App
| App | Download | Rating | Maker |
|---|---|---|---|
 Vernier Graphical Analysis GW Vernier Graphical Analysis GW |
Get App ↲ | 157 2.43 |
Vernier Software & Technology |
Or follow the guide below to use on PC:
Select Windows version:
Install Vernier Graphical Analysis GW app on your Windows in 4 steps below:
Download a Compatible APK for PC
| Download | Developer | Rating | Current version |
|---|---|---|---|
| Get APK for PC → | Vernier Software & Technology | 2.43 | 4.0.6 |
Get Vernier Graphical Analysis GW on Apple macOS
| Download | Developer | Reviews | Rating |
|---|---|---|---|
| Get Free on Mac | Vernier Software & Technology | 157 | 2.43 |
Download on Android: Download Android
- Multi-sensor data-collection support
- Time Based, Event Based, and Drop Counting data-collection modes
- Configurable data-collection rate and duration for time-based data collection
- Sensor calibrations
- Option to zero and reverse sensor readings
- Graph match feature for use with motion detectors
- Manual entry of data from keyboard and clipboard
- Display one, two, or three graphs simultaneously
- View data in a table or show a graph and table side-by-side
- Draw Predictions on a graph to uncover misconceptions
- Examine, interpolate/extrapolate, and select data
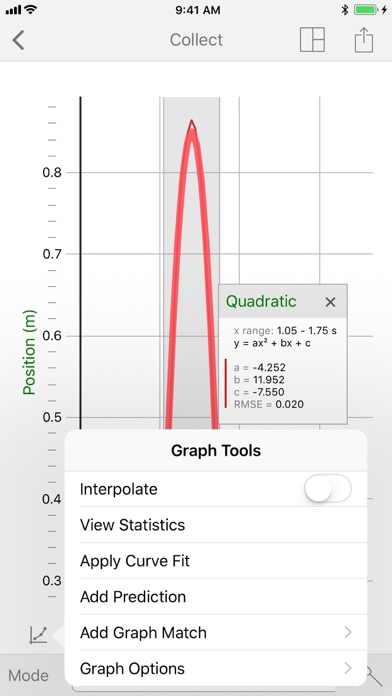
- Apply Statistics calculations to find mean, min, max, and standard deviation
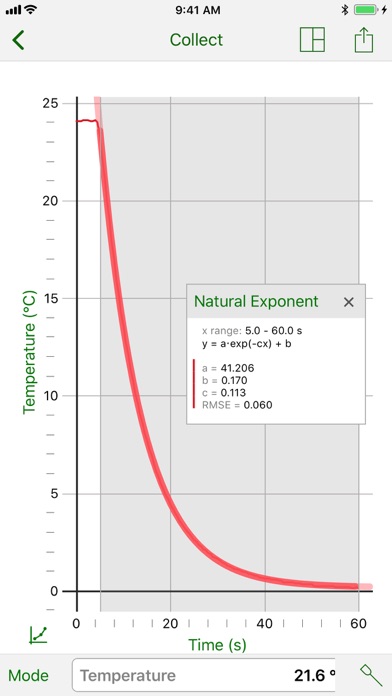
- Perform curve fits, including linear, quadratic, natural exponent, and more
- Add calculated columns based on existing data to linearize data or investigate related concepts
- Pinch to scale graphs
- Add graph titles
- Export graphs and data for printing and inclusion in lab reports
- Export data in .CSV format for analysis of data in spreadsheet software such as Excel, Google Sheets, and Numbers.
- Convenient for gas law experiments
- Works well with modifications on x & y axis through graph options
- Compatible with LabQuests for iPad users
- Bluetooth connection needs to be via software, not phone Bluetooth connection
- Creating graphs by manually inputting data can be clunky
- No integral function, which is essential for teaching physics
- App crashes every time when hitting apply for the curve
- Difficult to navigate and find what you want to do due to too much science lingo
Works well, but is missing some essentials.
It works well!
Not user friendly at all
Buggy
 PC Apps