Last Updated by Alexandre Caillet on 2025-01-25


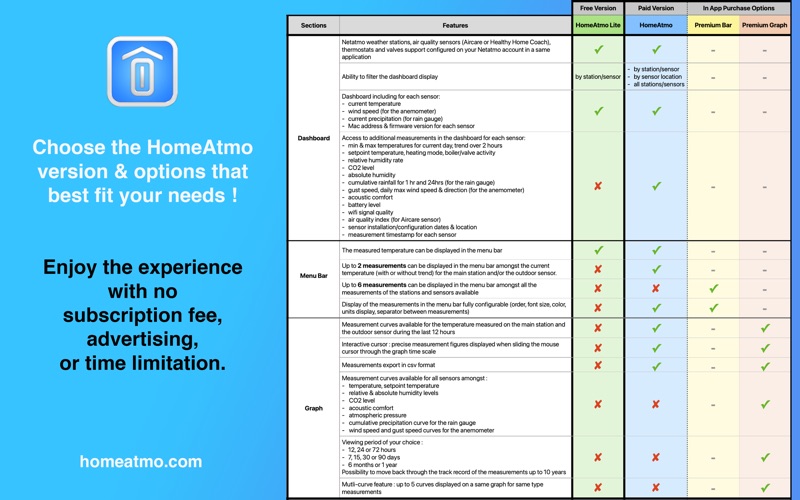

What is HomeAtmo? HomeAtmo is an app that allows you to view and manage your Netatmo weather stations, air quality sensors, thermostats, and valves in one place. The app provides a summary or detailed dashboard of your measurements, allowing you to compare values from different sensors. You can also customize a bar of measurements for each display filter and view multi-curve displays of the same type of measurements from all your sensors on the same graph. The app supports user preferences for measurement units.
1. Optionally, through the integrated purchase "HomeAtmo Premium Graphics" in the application, you have access to the multi-curve display for temperature, setpoint temperature, CO2 level, relative and absolute humidity, noise , atmospheric pressure for the station, outdoor sensor or even for the additional indoor sensors.
2. By remaining 2 seconds on the name of one of your sensors or one of your measurements in the dashboard, you can also view additional information such as the exact time of measurement, the location, the date of installation and sensor configuration or description of the measurement.
3. Optionally, through the integrated purchase "Premium bar of measures" in the application, you can select up to 6 measures to be displayed in the menu bar amongst any sensor and type of measurement you have and choose their display order.
4. A detailed view, accessible with a single click, allows you to display additional data such as the battery level, the signal quality of each sensor and much more.
5. By default, you can view and export the temperature curves for the main station and the outdoor sensor over the past twelve hours.
6. By default, you can select up to two measurements in the menu bar from the current temperature, with or without trend, for the main station and the outdoor sensor.
7. With this option, you can select the viewing period of your choice, namely 12 hours, 24 hours, 72 hours, 7 days, 15 days, 30 days, 90 days, 6 months and 1 year and move through the history of your measurements.
8. Depending on the measurement displayed, you can view the average, the total or the minimum and maximum value on the displayed period.
9. An interactive cursor allows you to view the value of the measurement at a given time.
10. The application also allows you to easily switch from displaying data from one weather station to another if you have associated several weather stations with your Netatmo account.
11. The interface has been developed to offer a global view and to be able to compare values of the same kind from different sensors.
12. Liked HomeAtmo? here are 5 Weather apps like HomeAtmo; HomeAtmo Lite : Netatmo client; baratmo - A netatmo client; AtmoTV - Netatmo Client; Netmo - The Netatmo Client;
Or follow the guide below to use on PC:
Select Windows version:
Install HomeAtmo : The Netatmo client app on your Windows in 4 steps below:
Download a Compatible APK for PC
| Download | Developer | Rating | Current version |
|---|---|---|---|
| Get APK for PC → | Alexandre Caillet | 1 | 2.9.2 |
Get HomeAtmo on Apple macOS
| Download | Developer | Reviews | Rating |
|---|---|---|---|
| Get $1.99 on Mac | Alexandre Caillet | 0 | 1 |
Download on Android: Download Android
- View and manage Netatmo weather stations, air quality sensors, thermostats, and valves in one app
- Display a summary or detailed dashboard of your measurements
- Compare values from different sensors
- View additional data such as battery level and signal quality with a single click
- Automatically refreshes the display of your measurements
- Easily switch between displaying data from different weather stations
- Apply filters to display the dashboard by station, location, or all stations
- Customize a bar of measurements for each display filter
- Select up to 6 measures to be displayed in the menu bar with the Premium bar of measures purchase
- Configure the size of the font, display of units, HomeAtmo icon, icons in front of your measurements, and addition of a separator between each measurement in the bar
- Access additional information by leaving your mouse for more than 2 seconds on one of the values displayed in the bar
- View and export multi-curve displays of the same type of measurements from all your sensors on the same graph
- Select the viewing period of your choice, ranging from 12 hours to 1 year
- View the average, total, or minimum and maximum value on the displayed period
- Export all measurements in CSV format
- Support user preferences for measurement units, including C° or F°, mbar, inHg or mmHg, mm or inch, and km/h, mph, m/s, knot, beaufort.
nice
Finally something useful
Works great!
Nice layout
 PC Apps