Last Updated by Quinn-Curtis, Inc. on 2025-04-03
What is QC SPC Chart Intro Version?
The QC SPC Chart software is a mobile application designed for quality control professionals and students who want to view industry standard statistical quality control charts on their mobile devices. The app allows users to monitor critical quality factors in manufacturing, process, and service industries and display the results in one of the many supported chart types. The software automatically calculates SPC control limits using historical data for the supported variable control chart and attribute control chart types. The app also generates alarms for standard +3 sigma control limits or the WECO (Western Electric) rules. The SPC charts are displayed as one or two synchronized charts, under the control of a scroll bar. The app allows users to customize the SPC chart and control limits using built-in setup forms.
1. The QC SPC Chart software is an interactive SPC chart (6-sigma) application aimed at quality control professionals (and students) who want to view industry standard statistical quality control charts on their mobile devices.
2. The software will automatically calculate SPC control limits using historical data for the supported variable control chart and attribute control chart types.
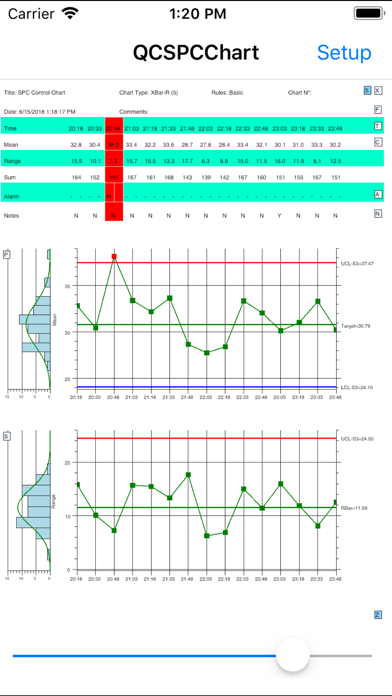
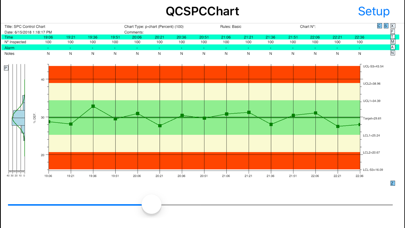
3. Chart types include: variable control charts (XBar-R, XBar-Sigma, Individual-Range, and Median-Range), and attribute control charts for monitoring defects (p-, np-, c-, u-, and DPMO charts).
4. The user can customize the SPC chart and control limits using built-in setup forms.
5. An integrated table appears above the chart, that displays information about the process under view, and each sample interval plotted in the chart.
6. Typical users will monitor critical quality factors in manufacturing, process, and service industries, and display the results in one of the many supported chart types.
7. The scroll bar can be replaced by an integrated zoom control which allows for the display of charts with a custom time frame.
8. The table displays time, individual sample values, sample statistics, process indices, alarm status, and any notes entered for that sample interval.
9. The entire chart setup, and data, can be saved on the host device so that they are easily accessible the next time you use the app.
10. Alarms can be generated for standard +3 sigma control limits, or the WECO (Western Electric) rules.
11. In the student version of the software the total number of sample intervals (data points) which can be displayed at one time is limited to 100.
12. Liked QC SPC Chart Intro Version? here are 5 Education apps like Star Chart; 3D Saxophone Fingering Chart; Star Chart Infinite; 3D Flute Fingering Chart; My Human Design Chart — Sappio;
GET Compatible PC App
| App | Download | Rating | Maker |
|---|---|---|---|
 QC SPC Chart Intro Version QC SPC Chart Intro Version |
Get App ↲ | 5 4.20 |
Quinn-Curtis, Inc. |
Or follow the guide below to use on PC:
Select Windows version:
Install QC SPC Chart Intro Version app on your Windows in 4 steps below:
Download a Compatible APK for PC
| Download | Developer | Rating | Current version |
|---|---|---|---|
| Get APK for PC → | Quinn-Curtis, Inc. | 4.20 | 29 |
Get QC SPC Chart Intro Version on Apple macOS
| Download | Developer | Reviews | Rating |
|---|---|---|---|
| Get Free on Mac | Quinn-Curtis, Inc. | 5 | 4.20 |
Download on Android: Download Android
- Supports variable control charts (XBar-R, XBar-Sigma, Individual-Range, and Median-Range) and attribute control charts for monitoring defects (p-, np-, c-, u-, and DPMO charts)
- Automatically calculates SPC control limits using historical data
- Generates alarms for standard +3 sigma control limits or the WECO (Western Electric) rules
- Calculates process capability ratios (Cp, Cpk) and process performance indices (Pp, Ppk)
- Allows users to add a set of specification limits to the chart
- Displays SPC charts as one or two synchronized charts, under the control of a scroll bar
- Allows users to customize the SPC chart and control limits using built-in setup forms
- Supports both auto-calculated and manually set control limits
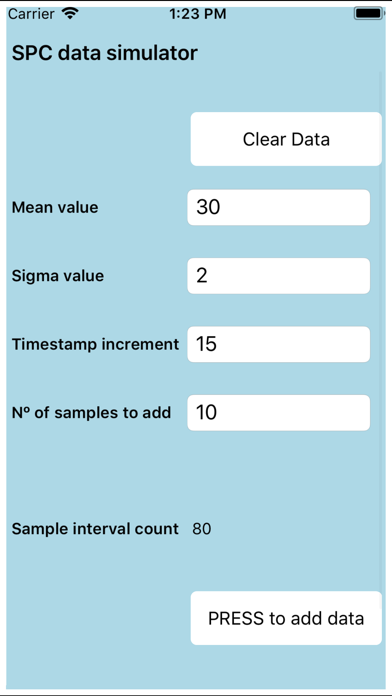
- Allows users to manually input and edit sample data from within the program
- Allows users to import sample data from a CSV (comma separated value) file
- Saves the entire chart setup and data on the host device for easy accessibility
- Displays a lot of information on the screen at once
- Recommended for devices with a minimum of 1200x800 pixel resolution, landscape or portrait mode
- Student version limits the total number of sample intervals (data points) that can be displayed at one time to 100.
Can’t load data from external file
 PC Apps